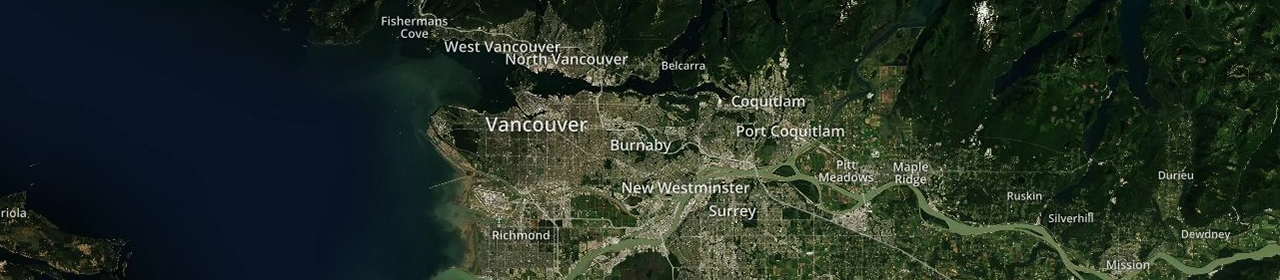
Description: Interactive map with clickable buttons and light boxes created using CartoDB. Example 1. Please, click to polygon or button.
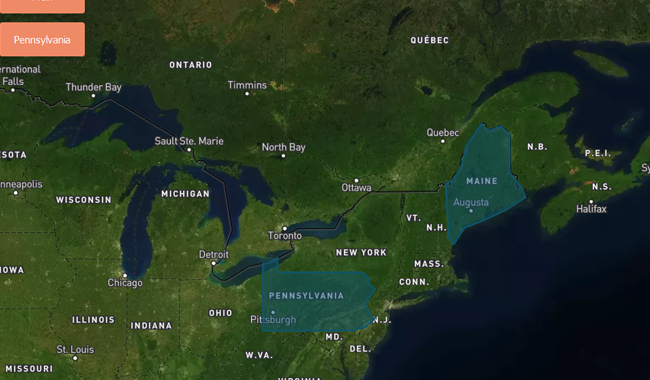
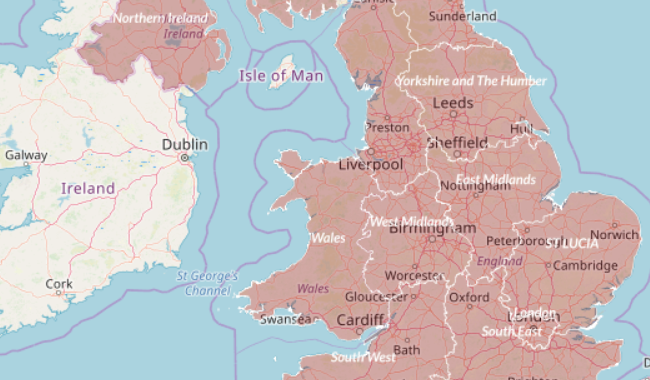
Show a map with fly to animated polygons created using MapBox
Description: Show a map with fly to animated polygons and labels created using MapBox GL JS Example 1. Please, click
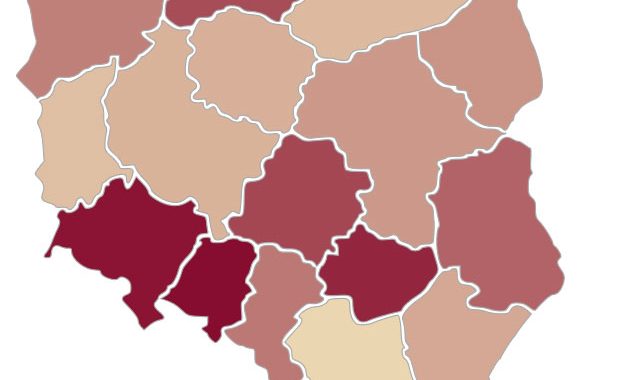
Interactive Intensity Map created using D3.js
Description: Interactive Intensity Map created using D3.js. Demo 1: Demo 2: https://mapper.guru/map/d3/map.html Output data: – .html,
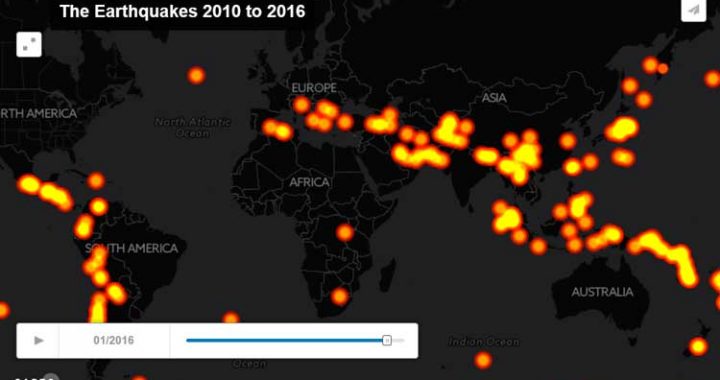
Animated map created using CartoDB with time slider
Description: An animated map created using CartoDB and Torque.js. Demo 1: