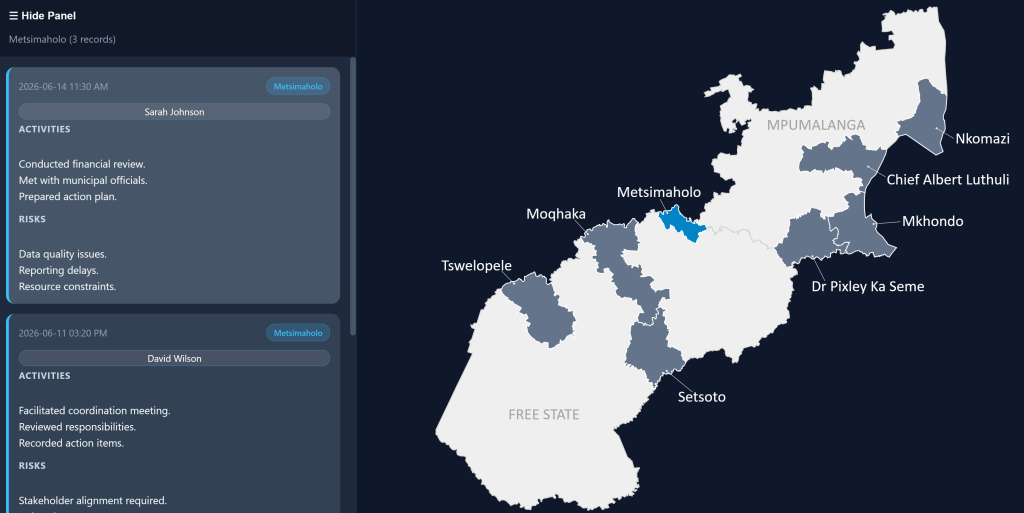
Interactive Municipality Monitoring Dashboard
Overview This project is an interactive web-based dashboard designed to visualize and monitor project activities across multiple municipalities. The dashboard combines a custom SVG map with live data from Google Sheets, providing stakeholders with an intuitive way to explore field updates and progress reports. Live Demo The solution displays municipalities on an interactive map and […]
Interactive Municipality Monitoring Dashboard Read More »