Overview
This project is an interactive web-based dashboard designed to visualize and monitor project activities across multiple municipalities. The dashboard combines a custom SVG map with live data from Google Sheets, providing stakeholders with an intuitive way to explore field updates and progress reports.
Live Demo
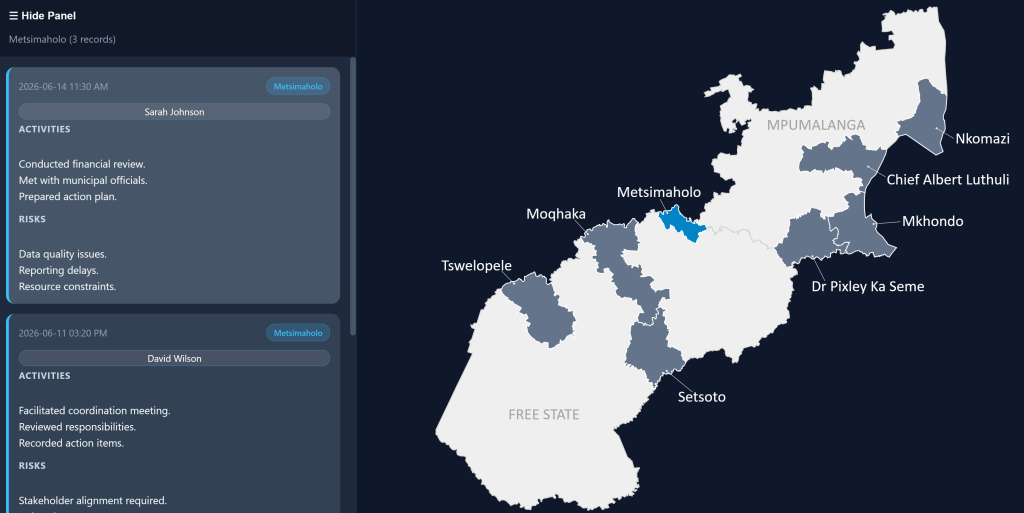
The solution displays municipalities on an interactive map and automatically loads project updates submitted by field advisors through a Google Form. As new submissions are added to the connected Google Sheet, the dashboard updates automatically without requiring manual data entry.
Users can click on any municipality to instantly filter and view only the updates related to that area, making it easy to track activities, risks, and project progress at the local level.
Key Features
- Interactive SVG municipality map
- Municipality-based filtering
- Live Google Sheets integration
- Automatic synchronization with Google Form submissions
- Responsive desktop and mobile layouts
- Collapsible information panel
- Chronological activity feed
- Advisor identification for each update
- Activity and risk tracking
- Smooth animations and modern user interface
- No database required — Google Sheets acts as the data source
Technology Stack
- HTML5
- CSS3
- JavaScript (Vanilla JS)
- SVG Mapping
- Google Sheets API
- Google Forms
Data Workflow
Field advisors submit updates through a Google Form. Responses are stored in Google Sheets, which serves as the central data repository. The dashboard retrieves the latest information through the Google Sheets API and displays it in real time within the interactive map interface.
Result
The final product provides a lightweight, easy-to-maintain monitoring platform that enables project managers and stakeholders to quickly explore project updates, identify risks, and monitor activities across multiple municipalities from a single interactive dashboard.
Get a Similar Map
If you need a custom interactive map like this:
- with custom UI
- data integration
- or advanced interactions
Send me your project idea or dataset — I can create a working demo for you.