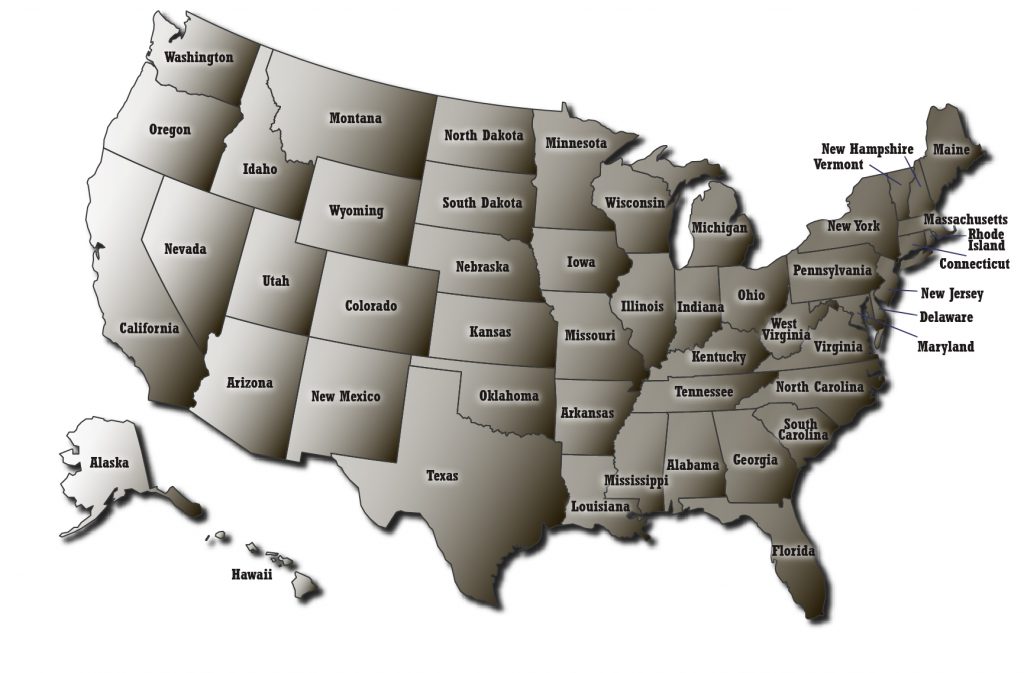
Interactive U.S. States and Counties Map
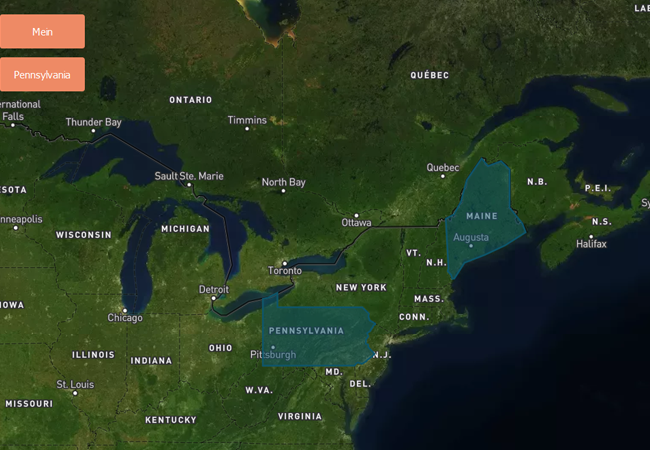
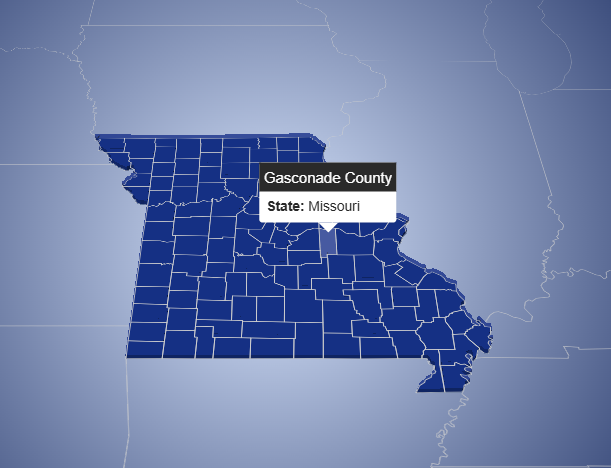
This interactive map visualizes administrative divisions of the United States, including all states and their respective counties. The application is built using modern JavaScript mapping libraries and integrates external datasets to enhance interactivity and data display. Technologies Used: Key Functionality: Data Content: The map displays the U.S. states and counties, sourced from custom Mapbox vector […]
Interactive U.S. States and Counties Map Read More »