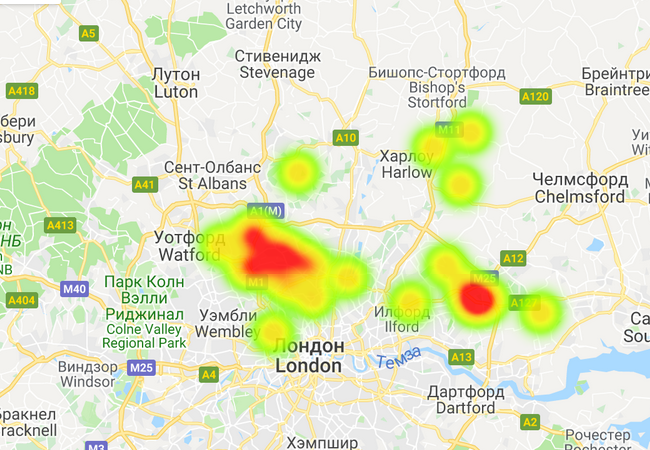
Heat map created using Google Fusion Tables
Description: Heat map created using Google Fusion Tables. Heatmaps display colors on the map to represent the density of points from a table. It is possible to configure filters, attributes, and more. Demo 1: Output data: – Google Spreadsheets – Excel tables – .kml, .csv files Features: – Setting of users access – Many […]
Heat map created using Google Fusion Tables Read More »