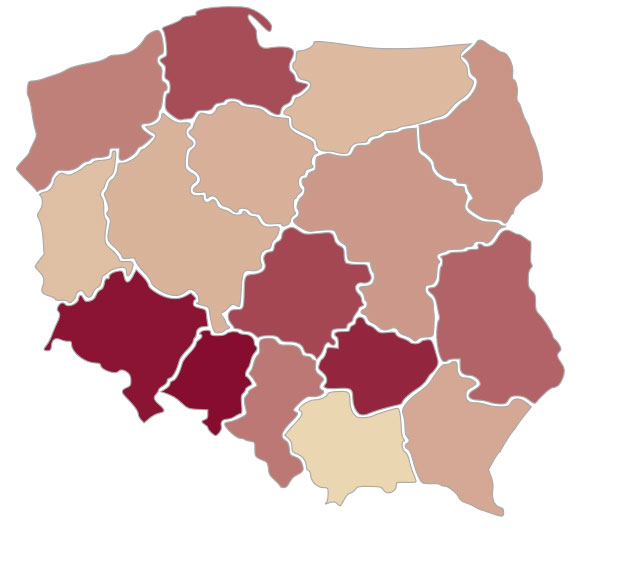
Interactive Intensity Map created using D3.js
Description: Interactive Intensity Map created using D3.js. Demo 1: Demo 2: https://mapper.guru/map/d3/map.html Output data: – .html, .css, .gejson, .js files Features: – Intensity Map Tools: – D3.js – QGIS Where to use: – Interactive maps on your web page [contact-form-7 id=”1059″ title=”Order”]
Interactive Intensity Map created using D3.js Read More »