This project is a custom-built interactive map created with Leaflet.js, designed for visualizing real-world data in a clean and user-friendly way.
Instead of using standard map popups, the interface includes a custom side panel that displays detailed information about each location.
Get a Free Demo for Your Project
Key Features
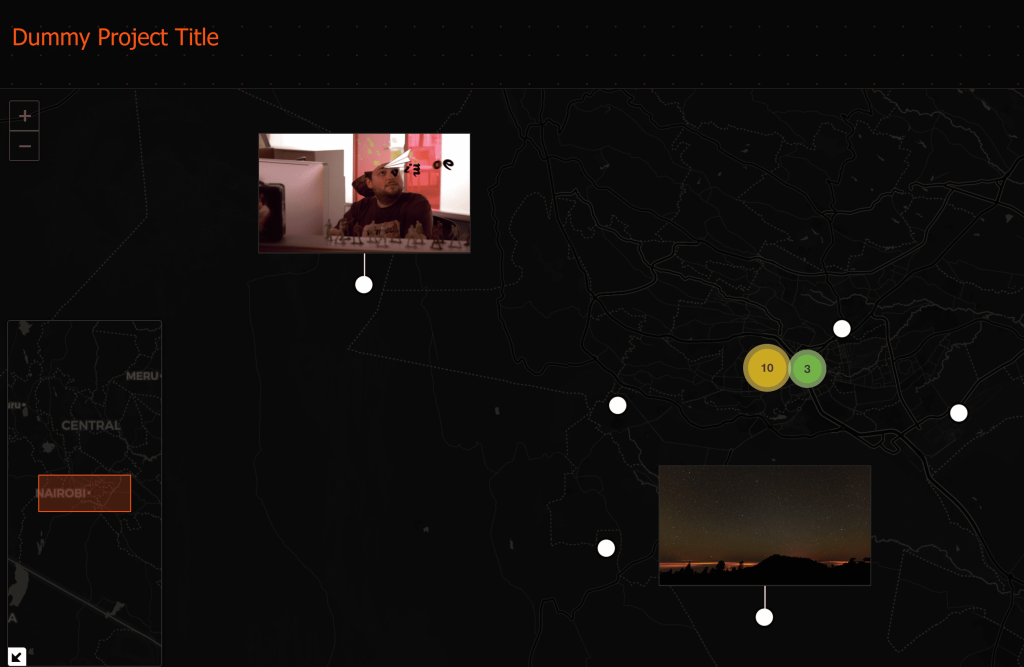
- Interactive markers with clustering for better performance
- Custom-designed markers using CSS (no default icons)
- Smooth user experience with a clean dark map style
- Mini map for better navigation and context
- Custom info panel instead of basic popups
- Conditional data rendering (only relevant info is shown)
- Embedded video previews directly on the map
- Fully responsive and mobile-friendly
Live Demo
How It Works
Each point on the map represents a data entry.
When a user clicks on a marker:
- a custom panel opens
- detailed information is displayed
- external sources can be accessed
Some locations also include video content displayed directly on the map using interactive tooltips.
Technologies Used
- Leaflet.js
- Marker Cluster plugin
- Custom JavaScript logic
- HTML / CSS for UI
- Embedded media (iframe video)
Use Cases
This type of interactive map is ideal for:
- OSINT and investigation dashboards
- Data visualization projects
- Security or incident tracking
- Research and analytics
- Storytelling with geospatial data
Why Custom Solution?
Unlike standard map plugins, this solution provides:
- full control over design and behavior
- better performance
- scalable architecture for large datasets
- ability to integrate complex UI elements
Get a Similar Map
If you need a custom interactive map like this:
- with custom UI
- data integration
- or advanced interactions
Send me your project idea or dataset — I can create a working demo for you.