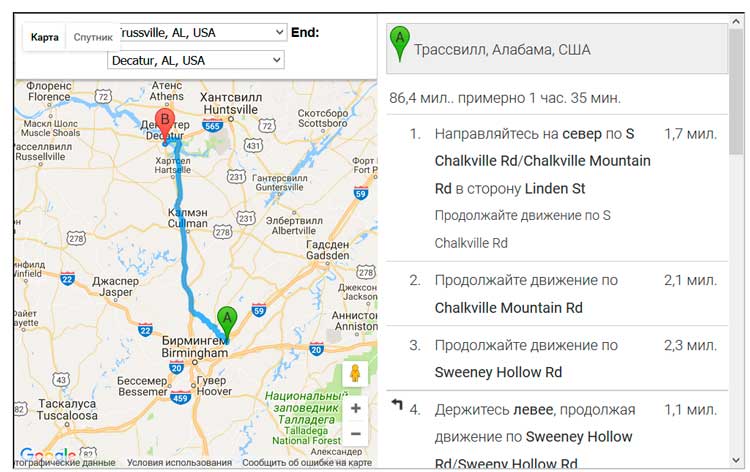
Route Map with directions service
Description: Route Map with directions service created using Google Maps JavaScript API. Demo 1: Demo 2:
Route Map with directions service Read More »
Description: Route Map with directions service created using Google Maps JavaScript API. Demo 1: Demo 2:
Route Map with directions service Read More »
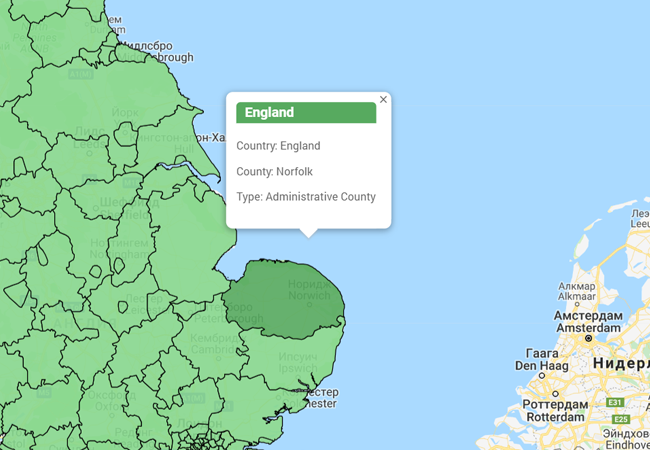
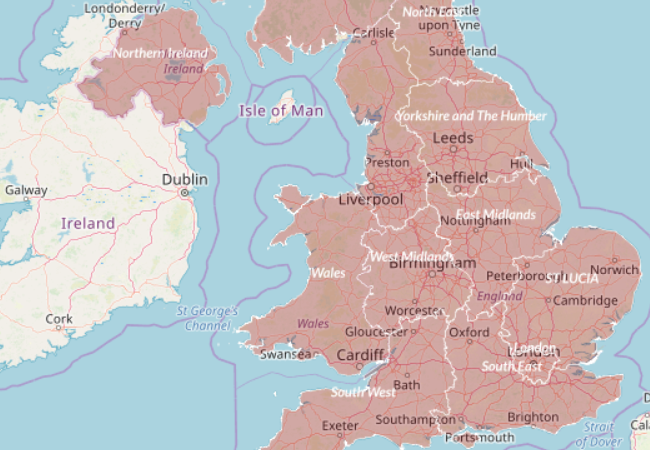
Sample 1. A map with polygons, custom popups and legend created using Google Maps API and geojson
A map with polygons, custom popups and hover animation Read More »
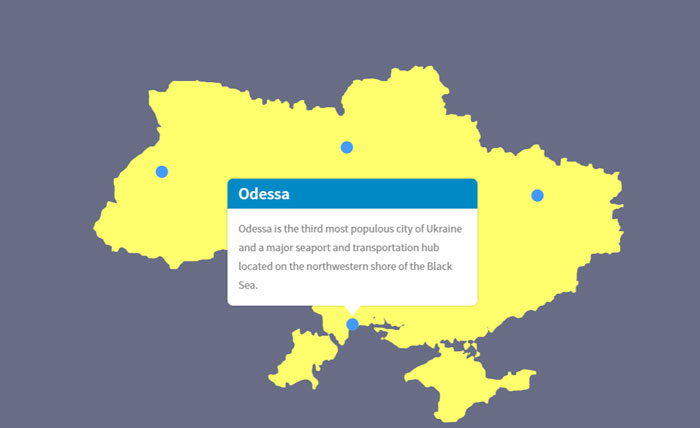
Sample 1. Animated map of Ukraine with popup
Animated map of Ukraine with popup Read More »
Description: Interactive map with clickable buttons and light boxes created using CartoDB. Example 1. Please, click to polygon or button.
Interactive map with light boxes created using CartoDB Read More »
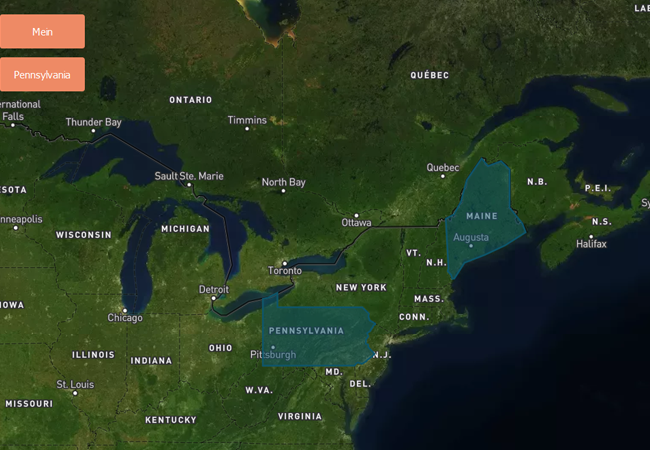
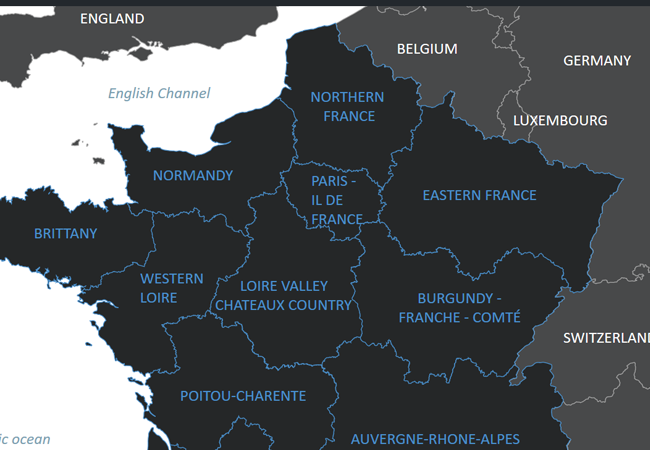
Description: Show a map with fly to animated polygons and labels created using MapBox GL JS Example 1. Please, click to polygon or button.
Show a map with fly to animated polygons created using MapBox Read More »
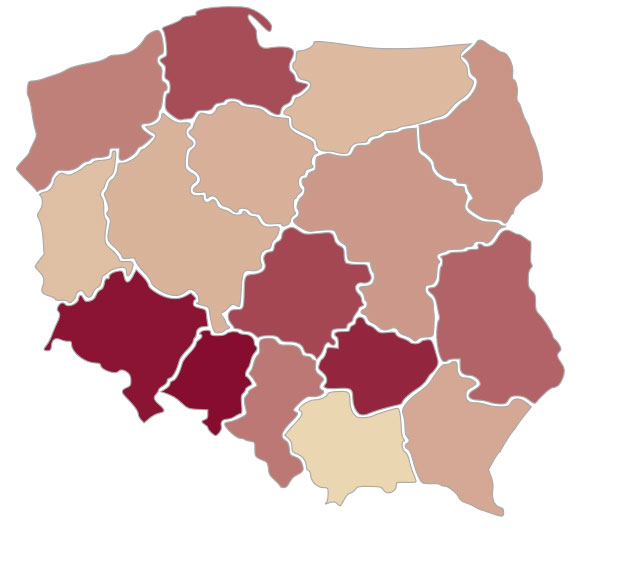
Description: Interactive Intensity Map created using D3.js. Demo 1: Demo 2: https://mapper.guru/map/d3/map.html Output data: – .html, .css, .gejson, .js files Features: – Intensity Map Tools: – D3.js – QGIS Where to use: – Interactive maps on your web page [contact-form-7 id=”1059″ title=”Order”]
Interactive Intensity Map created using D3.js Read More »
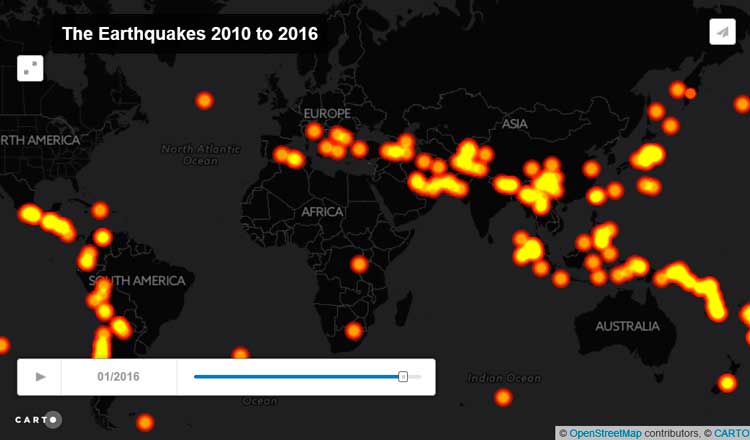
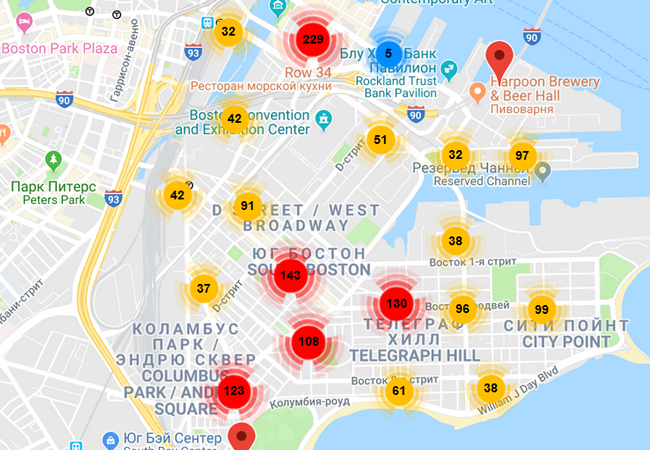
Description: An animated map created using CartoDB and Torque.js. Demo 1:
Animated map created using CartoDB with time slider Read More »
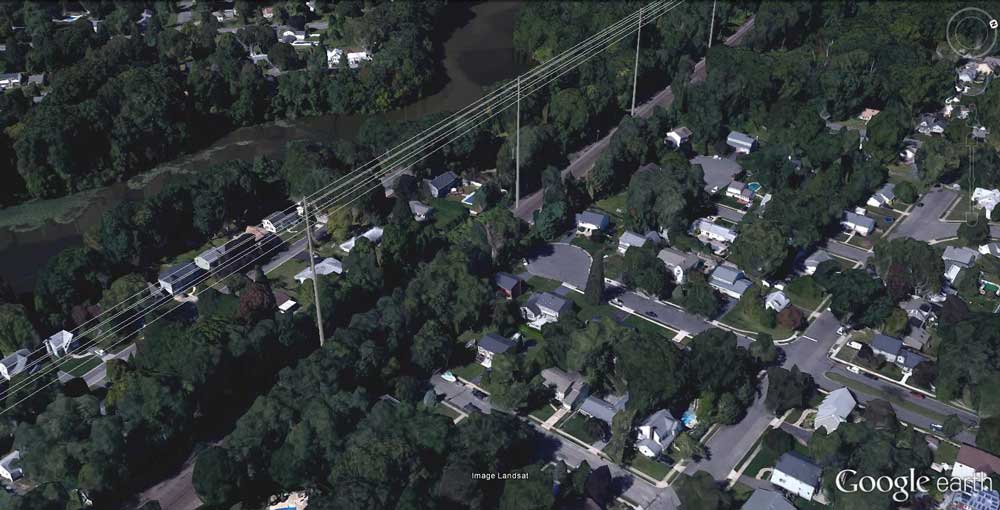
Description: Simple 3d model of lines electric transmission created with SketchUp and placed on the surface of Google Earth. As well as recording a videotour in Google Earth created using Movie Maker. Demo 1: > Video: Output data: – Drawing of model – Route map Features: – 3D objects on the surface of
3d model and video tour of Google Earth Read More »