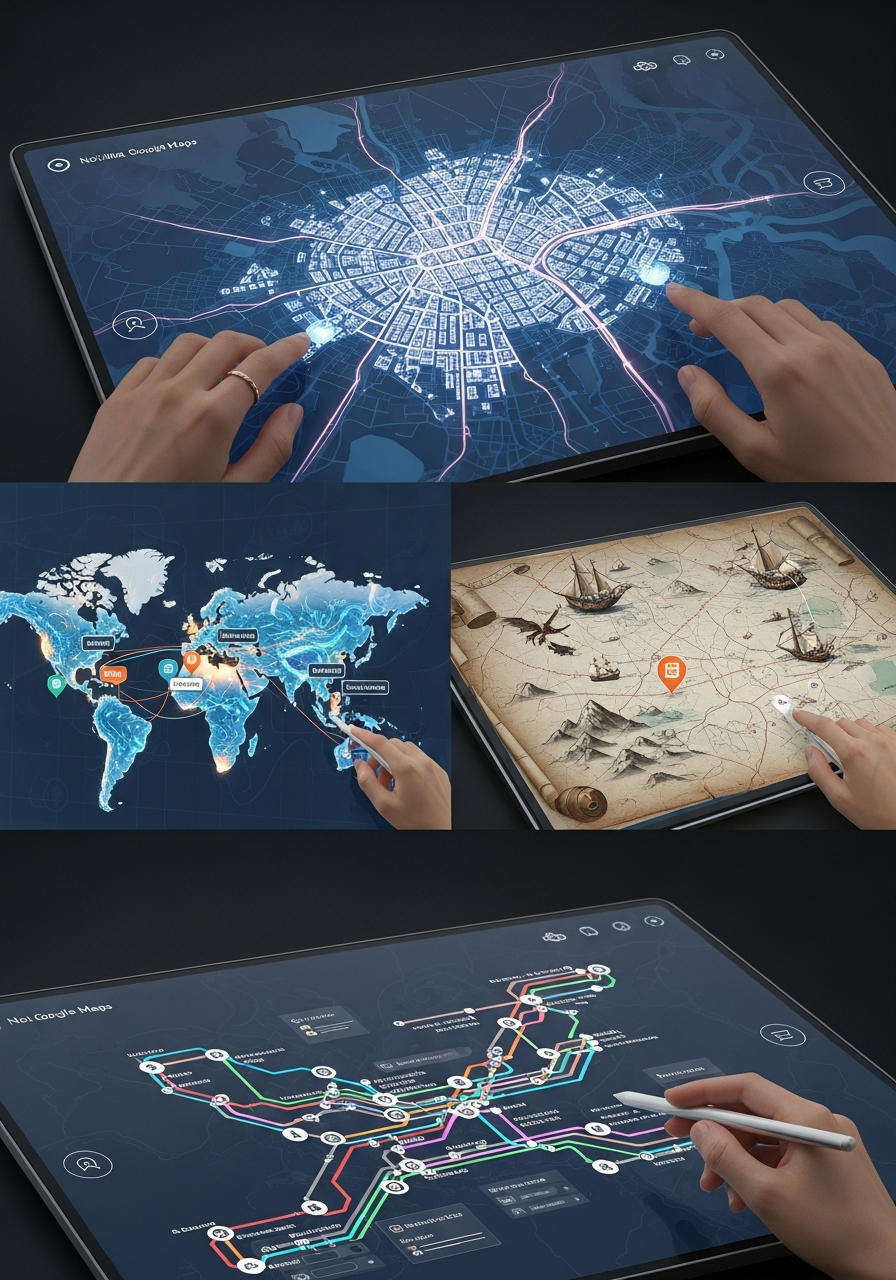
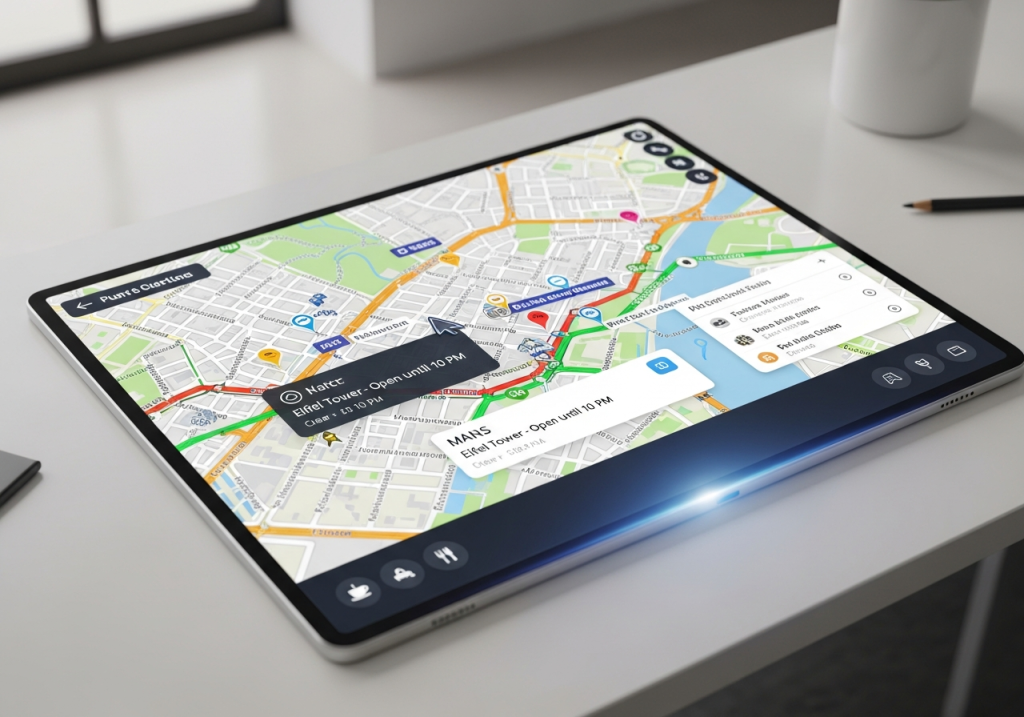
Custom interactive maps that engage users, highlight key locations, and make complex information easy to explore and understand.
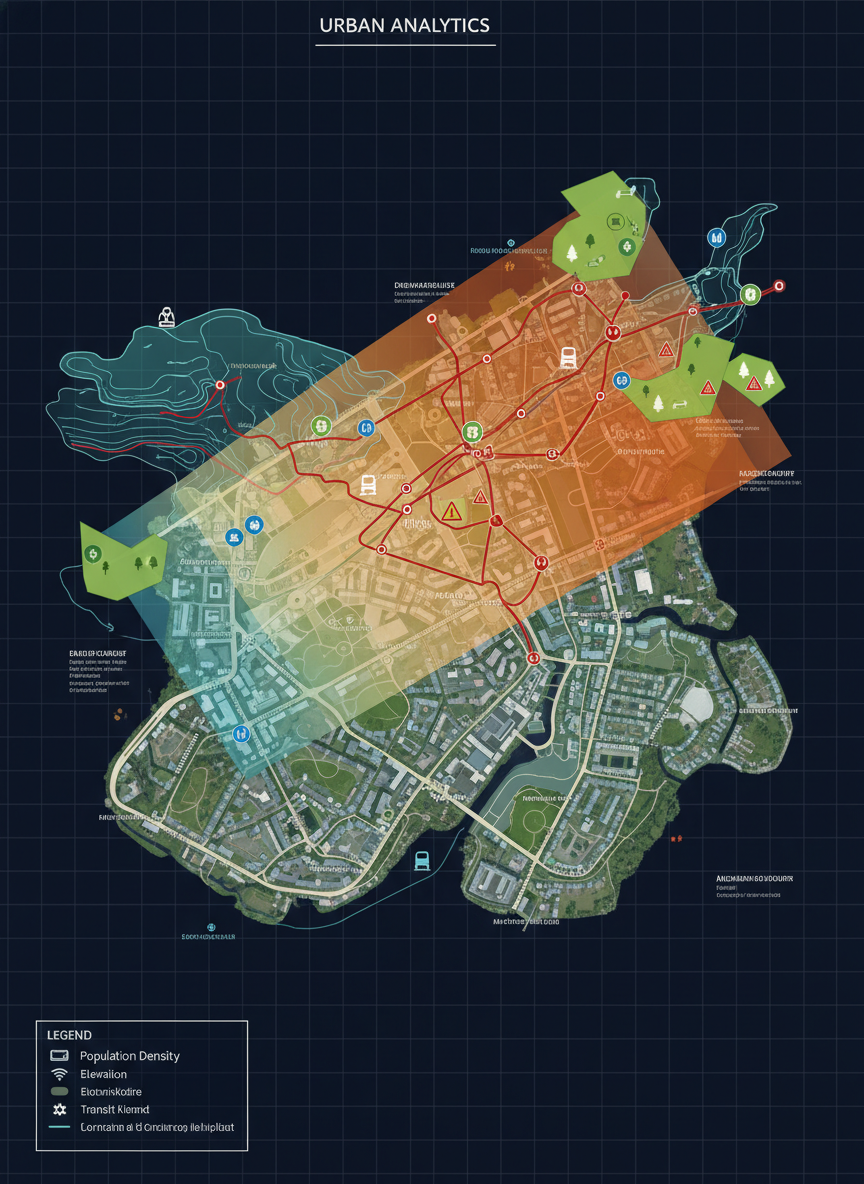
GIS Maps
Professional GIS-based maps built to visualize spatial data accurately, support analysis, and communicate insights clearly.
Video Maps Animations
Map-based video animations that tell stories, show change over time, and present geographic data in a dynamic way.
About us
We work with maps as both data tools and visual storytelling elements. From interactive web maps to GIS visualizations and map animations, we help turn locations and spatial data into engaging digital experiences.
Talk to us
Have questions about maps? We’re always open to discussing interactive maps, GIS projects, map animations, and how we can help bring your ideas to life.